Numbers showing the prevalence of Bladder Cancer in Italy.
We take stock of the prevalence of bladder cancer in Italy, based on official sources.
Bladder cancer in Italy
New cases of bladder cancer
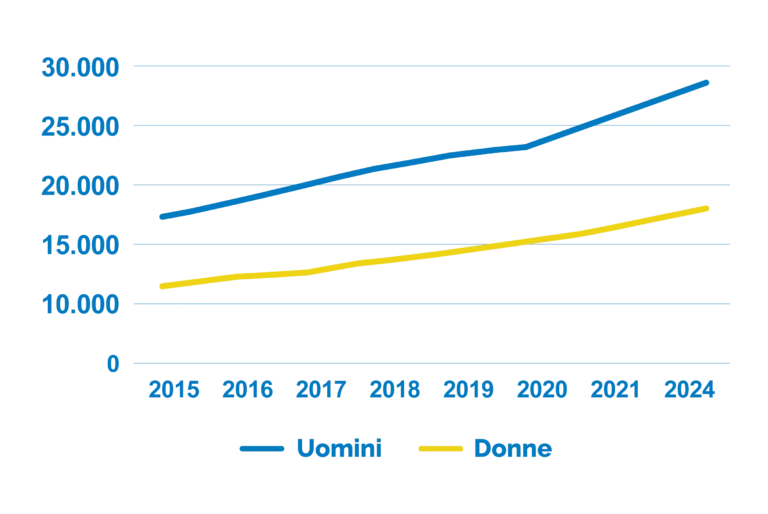
New annual diagnoses
In 2024, about 31,016 new cases of bladder cancer were diagnosed in Italy, up from previous years. - Source: fondazioneveronesi.it
-25,227 in men
- 5,789 in women
-25,227 in men
- 5,789 in women
Incidence rates (2019) - AIOM/AIRTUM data.
- Men: 78.8 cases per 100,000 population per year.
- Women: 15.4 cases per 100,000 population per year. - Source: reteoncologicacampana.it
- Women: 15.4 cases per 100,000 population per year. - Source: reteoncologicacampana.it
Cumulative risk in the vitta

Cumulative risk during lifetime
Annual incidence provides timely insight, but to estimate cumulative risk over a lifetime, incidence rates can be applied to average life expectancy.
A simplified method:
- If we consider a man's life expectancy up to ~85 years.
- A constant rate of 78.8/100,000 in men corresponds to about 6.7‰ per year (78.8 ÷ 100,000 × 1,000).
- Accumulating for ~85 years (without considering mortality from other causes), we get a crude estimate of: 6.7 × 85 ≈ 569‰ or ~57%, but this is anobvious overestimate because it ignores mortality from other causes and changes in risk.
- More accurate estimates based on registries (AIRTUM, AIOM) and epidemiological methodologies report the following data:
- Male ~2.4%: 1 in 42
- Female ~0.6%: 1 of 167
These values are considered reliable as long as they are supplemented with data on life expectancy and overall mortality. - Source: airc.co.uk, register-tumors.co.uk, en.wikipedia.org
A simplified method:
- If we consider a man's life expectancy up to ~85 years.
- A constant rate of 78.8/100,000 in men corresponds to about 6.7‰ per year (78.8 ÷ 100,000 × 1,000).
- Accumulating for ~85 years (without considering mortality from other causes), we get a crude estimate of: 6.7 × 85 ≈ 569‰ or ~57%, but this is anobvious overestimate because it ignores mortality from other causes and changes in risk.
- More accurate estimates based on registries (AIRTUM, AIOM) and epidemiological methodologies report the following data:
- Male ~2.4%: 1 in 42
- Female ~0.6%: 1 of 167
These values are considered reliable as long as they are supplemented with data on life expectancy and overall mortality. - Source: airc.co.uk, register-tumors.co.uk, en.wikipedia.org
Why so much gap between annual rates and cumulative risk?
1. Competitive mortality: many people die of other causes before reaching high-risk situations.
2.Time- and age-varying rates: risk increases with age, but does not remain constant.
3.Epidemiological methodologies: AIRTUM/AIOPM estimates integrate demographic factors and overall mortality, providing a realistic-cumulative view.
2.Time- and age-varying rates: risk increases with age, but does not remain constant.
3.Epidemiological methodologies: AIRTUM/AIOPM estimates integrate demographic factors and overall mortality, providing a realistic-cumulative view.
Final Summary